Last-Mile Delivery Route Optimization in the US: How to Plan Routes Around Real Stop Times, Curbs and Weather
Drafted with AI assistance, edited and fact-checked by Sean Flannery. See our editorial policy.
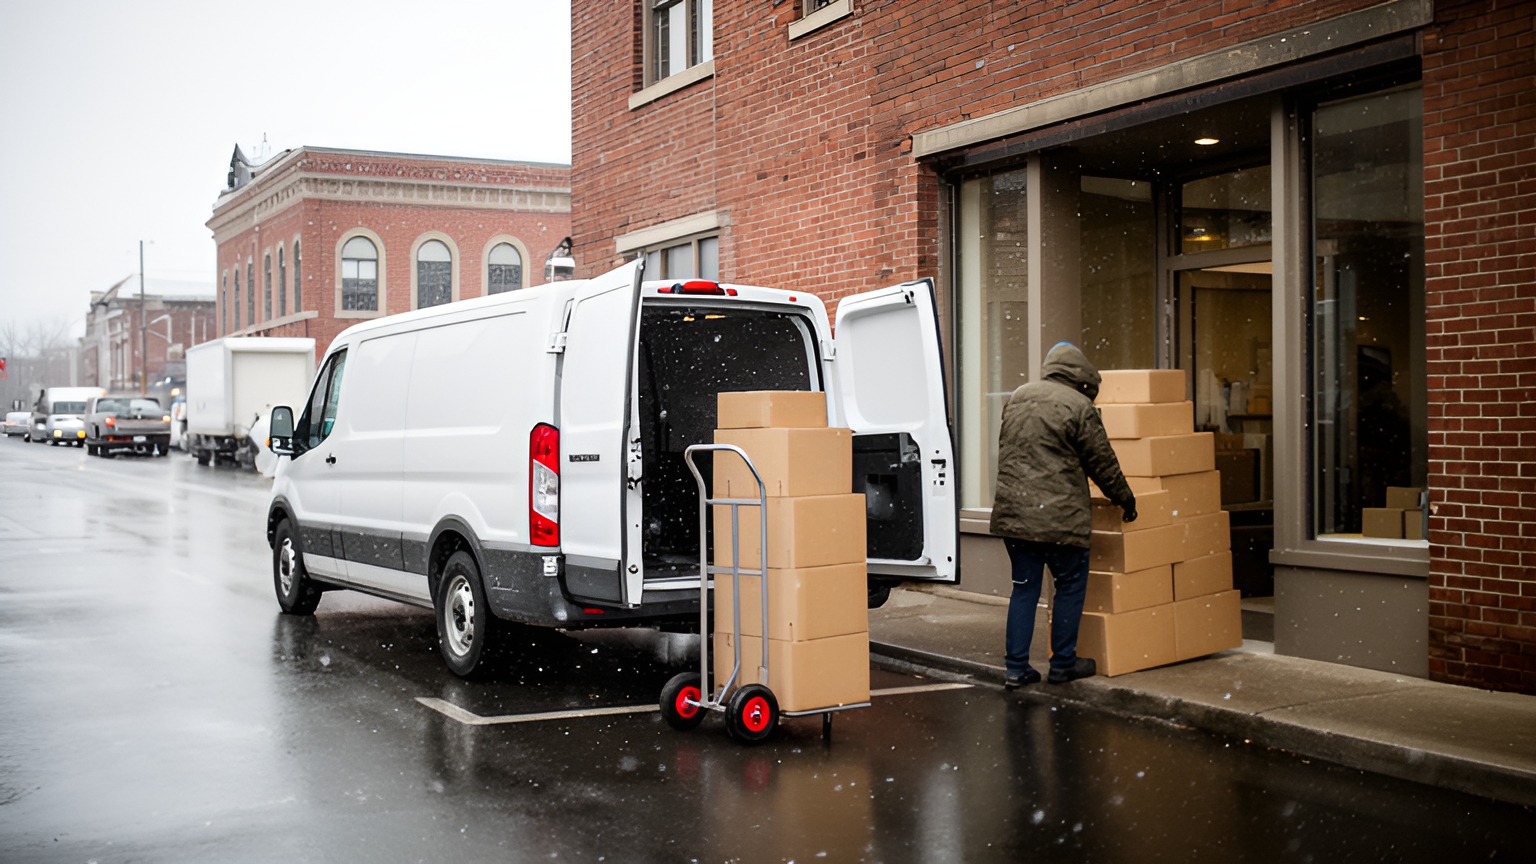
Last mile delivery route optimization in the US works best when routes are planned around the time spent at each stop, not just the miles driven. Set service times by stop type, build curb access into dense urban stops, slow arterial estimates for snow or wet pavement using Federal Highway Administration figures, and re-sequence the route as same-day orders arrive.
A route that looks tight on a map can still finish late. The miles are right, but the minutes at each door, each loading zone and each icy arterial are missing from the plan.
Those minutes are the part a planner can actually control.
Why stop time, not just miles, shapes last-mile route optimization
MIT's Center for Transportation and Logistics, writing about last-mile delivery in general, puts it plainly on its last-mile delivery research page: "Delivery vehicles spend 90% of the time parked or idling."
So the planning number with the most room for error is the time each stop takes, not the distance between stops.
A miles-only plan treats two addresses a block apart as almost the same stop. In practice, one might be a quick porch drop and the other a signature delivery on an upper floor of an apartment building.
Distance still matters, especially on long rural runs where drive legs fill much of the day. On dense urban routes, service time, curb access and the walk from the vehicle to the door carry more weight.
Planning around stop time also depends on a plan that is quick to build and easy to change.
That is where SuperPharmacy, an Australian online pharmacy that has delivered prescriptions nationwide since 2000, is a useful reference. Its case study reports that the delivery team was spending up to one hour every day manually planning routes, and that a new urgent prescription or a rescheduled delivery meant regenerating the entire route from scratch.
With Locate2u route optimization, routes are generated automatically from delivery locations, time windows and driver availability. New prescriptions can be slotted into existing routes during the day without disrupting other deliveries, which enabled SuperPharmacy to offer same-day prescription delivery as a core service.
"Before Locate2u, we had to generate new routes if we wanted to change anything. Now we can adjust the day's deliveries on the fly."
Daily planning that once took up to an hour now takes 10 minutes, a result from one Australian pharmacy that is worth testing against a week of your own US routes.
How to set service times by stop type, from porch drops to signature stops and multi-unit buildings
The US Census Bureau reports that e-commerce sales in the second quarter of 2026 accounted for 17.1 percent of total retail sales, on a seasonally adjusted basis.
Every one of those orders that ships to an address becomes a stop with its own handoff. So the service time attached to each stop type deserves the same care as the drive time between stops.
A single default, such as the same few minutes for every stop, hides the real difference between stop types. Split stops into types your records can recognize:
- Porch or doorstep drops, where the driver parks, walks up, places the parcel and takes a photo
- Signature stops, which add time for the recipient to come to the door and sign
- Multi-unit buildings, where an entrance, elevator, front desk or mailroom sits between the curb and the unit
- Business deliveries, which depend on receiving hours and where the receiving door is
- Heavy or bulky items, which may need a hand truck or a second person
Then set a planned service time for each type from what your vehicles actually record. A median works better than an average here, because one unusually long stop will not drag the whole type upward.
Two refinements help. Add a small per-item allowance for stops with several parcels, and plan a first visit to an address slightly longer than a repeat visit where access notes already exist.
When you test planning software, check that it accepts a service time per stop or per stop type, and that it carries that time into every ETA after the stop.
How to plan dense urban stops around curb and loading-zone access
On a busy downtown block, the hardest part of a delivery to plan is often the final stretch between a legal place to stop and the recipient's door.
The Federal Highway Administration's urban freight guidance notes that trucks may need to deliver from the sidewalk when no off-street loading dock or facility is available, and that where curbside areas are limited, they are often forced to circle or double park.
That time never shows up as miles. It shows up as a stop that ran longer than planned, so curb access belongs inside the stop sequence as a planning constraint.
Start by recording access notes against each address: where the nearest loading zone is, which entrance receiving uses, and the hours a dock is open. A driver arriving with those notes can go straight to the right spot.
Give stops with no reliable curb space a longer planned service time than a similar stop with a dock. It is better for the plan to expect the extra minutes than for every later ETA to slip.
Group stops that share one good parking spot into a single park point, then plan the walking time between them. One well-chosen spot serving several nearby addresses keeps the vehicle off the block loop.
Sequence commercial blocks for the hours when loading zones and receiving docks are open. Loading-zone and permit rules vary by city, so check the current requirements with the local transportation department before building a route around a zone.
Finally, give each tight stop a fallback, such as a second loading zone or a side entrance. A fallback in the stop notes turns a judgment call at the curb into a planned option.
How to keep winter and wet-day ETAs realistic with FHWA speed adjustments
The Federal Highway Administration reports that over 70 percent of the nation's roads are located in snowy regions, which receive more than five inches (13 cm) of average snowfall annually.
That is road mileage, not delivery stops. But for any fleet running routes in those regions, a winter speed profile belongs in the route plan.
FHWA also puts a number on the slowdown. On the same FHWA snow and ice page: "Average arterial speeds decline by 30 to 40 percent on snowy or slushy pavement."
Rain matters too. FHWA's rain and flooding page states: "Speed reductions on arterial routes range from 10 to 25 percent on wet pavement."
Those figures apply to arterial roads. Residential streets and the walk from the vehicle to the door on ice are separate, so measure those from your own records.
Apply the percentages to speed, not to time. Drive time equals distance divided by speed, so divide the dry-weather minutes by one minus the speed reduction instead of multiplying.
Worked example: say the arterial legs on a suburban route add up to 63 minutes in dry conditions.
On wet pavement, a 10 percent speed drop gives 63 ÷ 0.9 = 70 minutes, and a 25 percent drop gives 63 ÷ 0.75 = 84 minutes.
On snow or slush, a 30 percent drop gives 63 ÷ 0.7 = 90 minutes, and a 40 percent drop gives 63 ÷ 0.6 = 105 minutes.
So the same legs need between 7 and 21 extra minutes on a wet day, and between 27 and 42 extra minutes on a snowy one. Multiplying instead would plan the snowy day too short.
To put this into practice, keep separate dry, wet and winter speed profiles for arterial legs, and choose the profile the evening before using the forecast.
If conditions change mid-morning, re-plan the remaining stops and send fresh ETAs rather than letting the original times stand.
How time windows, vehicle capacity and load order fit into one route plan
Stop times and drive times set the clock. Time windows, capacity and load order decide which stops can share a route at all.
Start with windows. Mark which ones are hard, such as a business receiving slot or a delivery the recipient has arranged to be home for, and which are preferences the plan can stretch.
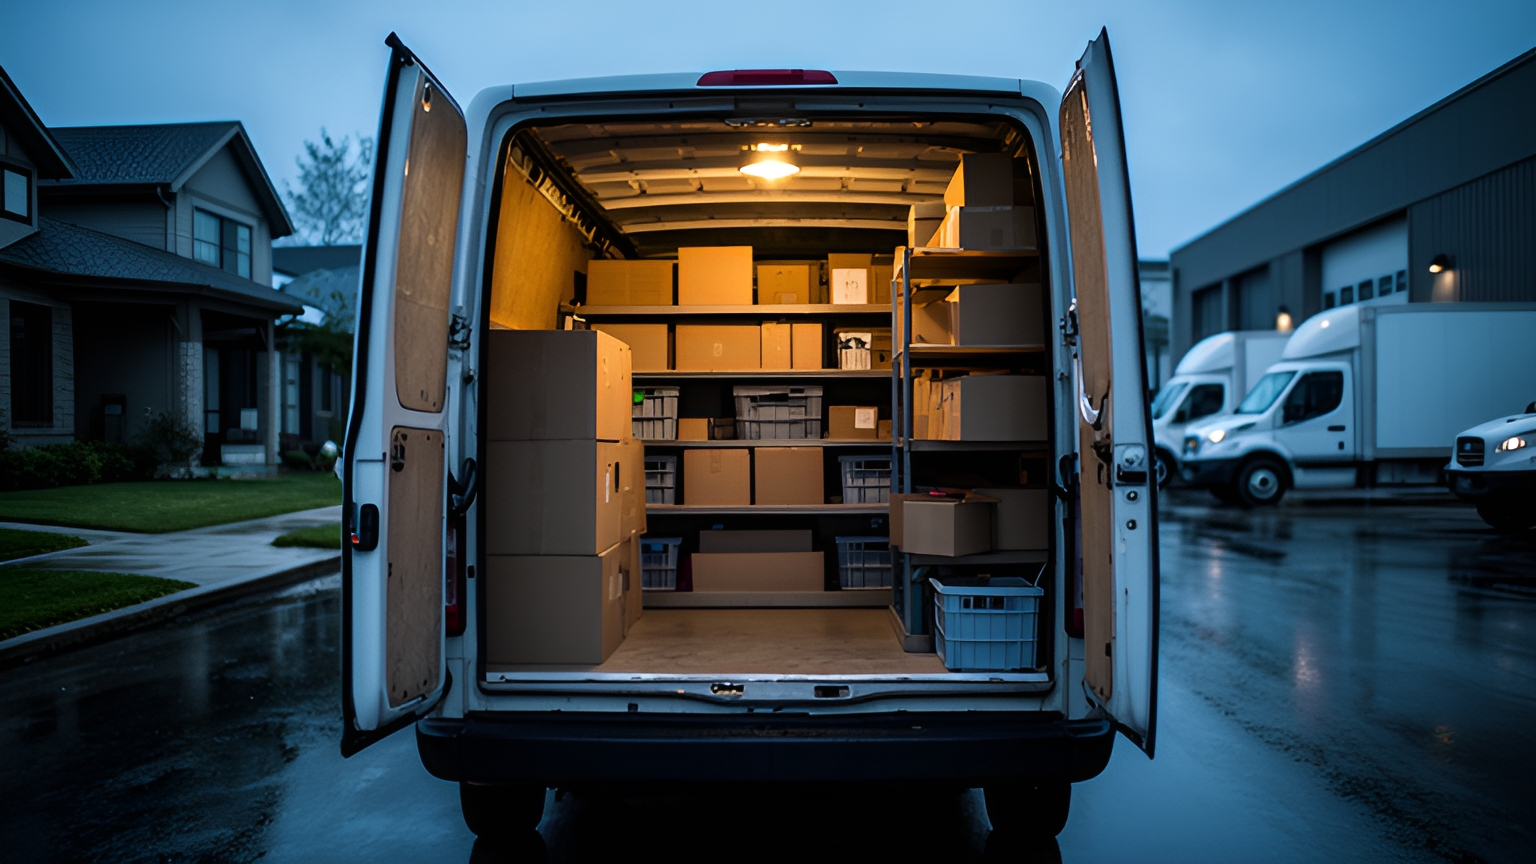
Capacity comes next. Set each vehicle's limit in the unit that runs out first for your goods, whether that is weight, volume or parcel count, so the plan never builds a route the van cannot carry.
Then match the load order to the stop sequence. The last stop goes in first, so the first stop's goods sit by the door.
Repeat attempts belong here too. A second attempt is a new stop on a later route, so record the reason and any access note at the first visit, giving the next visit what it needs.
Peak season tests all of this at once. The National Retail Federation forecast that online and other non-store sales for the 2025 holiday season would increase 8% to 9%, totaling US$312.2 billion to US$315 billion.
That makes November the time to have capacity limits and overflow plans already set, not the time to start writing them. For related ideas, see this guide to ways to reduce last-mile delivery costs.
How to re-sequence a route when same-day orders arrive
Same-day orders arrive while routes are already running. A short routine, repeated the same way every time, keeps them from unsettling the rest of the day.
Set a cutoff first. Decide the latest time a same-day order can join today's routes in each area, and share that cutoff with the team taking orders.
Then check fit. The new stop needs a route that passes nearby, has capacity left, and can reach it inside its window without pushing another hard window past its limit.
Insert the stop where it adds the least time. Hold stops that already have a promised ETA steady, so the change stays local instead of rippling through the whole route.
Finally, tell everyone affected. The driver needs the updated sequence, and any customer whose ETA moved needs a fresh one.
In Locate2u, new orders can be slotted into existing routes during the day, the same capability behind the pharmacy result described earlier. With real-time tracking, dispatchers see every vehicle on a live view and can share a live tracking link, so recipients can see their delivery approaching.
How realistic timelines support drivers through a long delivery day
The US Bureau of Labor Statistics notes: "Driving in congested traffic or adhering to strict delivery timelines can also be stressful."
A route plan cannot change traffic. It can make sure the timeline reflects the real work, which is planning around a known stress point.
Use service times from your records, not optimistic ones. Build breaks into the route as planned stops, so they sit inside the timeline.
Spread the longest stop types through the day where windows allow. And when a route runs behind, move a stop to another vehicle rather than asking the first driver to make up the time.
For driver hours and rest breaks, check the current requirements with the Federal Motor Carrier Safety Administration.
How to check planned stop times against what happens on the road
Every setting above starts as an estimate. The way to sharpen it is to compare the plan with the record of each completed stop.
Locate2u proof of delivery captures a photo, signature and timestamp for each delivery, which gives every completed stop a time on record.
Once a week, pull planned and actual times for each stop type and compare the medians. Do the same for arterial legs on wet and snowy days, and check how close the first ETA each customer received came to the actual arrival.
Worked example, on assumed figures from one week of stop records:
| Stop type | Planned service time (assumed) | Median from records (assumed) | Next week's setting |
|---|---|---|---|
| Porch drop | 2 minutes | 2 minutes | Keep as is |
| Signature stop | 3 minutes | 5 minutes | Raise to 5 minutes |
| Multi-unit building | 4 minutes | 7 minutes | Raise to 7 minutes |
In that example, porch drops are planned well, while signature stops and multi-unit buildings were planned short. Raising those two settings brings every later ETA on routes that include them closer to the road.
Make one change at a time, run it for a week, then compare again. Small, steady corrections keep the plan in step as seasons, addresses and order mix change.
Frequently asked questions
Does route optimization still apply if you run your own vans instead of using a last mile carrier?
Yes. A last mile carrier is simply whoever moves goods on the final leg to the recipient, and an in-house fleet faces the same stop-time, curb and weather constraints, so the same planning settings apply to your own vans.
What is the difference between a tracking number and a live tracking link for your customers?
A tracking number identifies a shipment and its recorded handoffs, while a live tracking link shows the vehicle's progress on the day. Locate2u's real-time tracking lets dispatchers share a live link so recipients can see when their delivery is approaching.
How do transit times relate to the stop-to-stop times in a route plan?
Transit time is the total span from dispatch to delivery, while a route plan breaks that span into drive legs plus service time at each stop. Adjusting either component, such as a slower winter leg or a longer signature stop, changes every transit time after it on the route.
What data should you gather before testing route optimization software on your own routes?
Collect a few weeks of real stop addresses, time windows, vehicle capacities and completed-stop timestamps, which proof of delivery records capture as each delivery is made. Then book a call with the Locate2u team to run that data through a planned route and compare the result with what happened on the road.
Last mile delivery route optimization pays off when the plan reflects real minutes: service times by stop type, curb notes for dense blocks, weather profiles for arterial legs and a steady routine for same-day orders. Start with the stop type your records show is planned shortest, fix that one setting, and explore how Locate2u route optimization builds routes from your own stops, or book a call with the Locate2u team to walk through a week of your routes.