Fleet Utilisation Metrics: How to Measure Time, Distance and Load Across a Delivery Fleet
Drafted with AI assistance, edited and fact-checked by Sean Flannery. See our editorial policy.
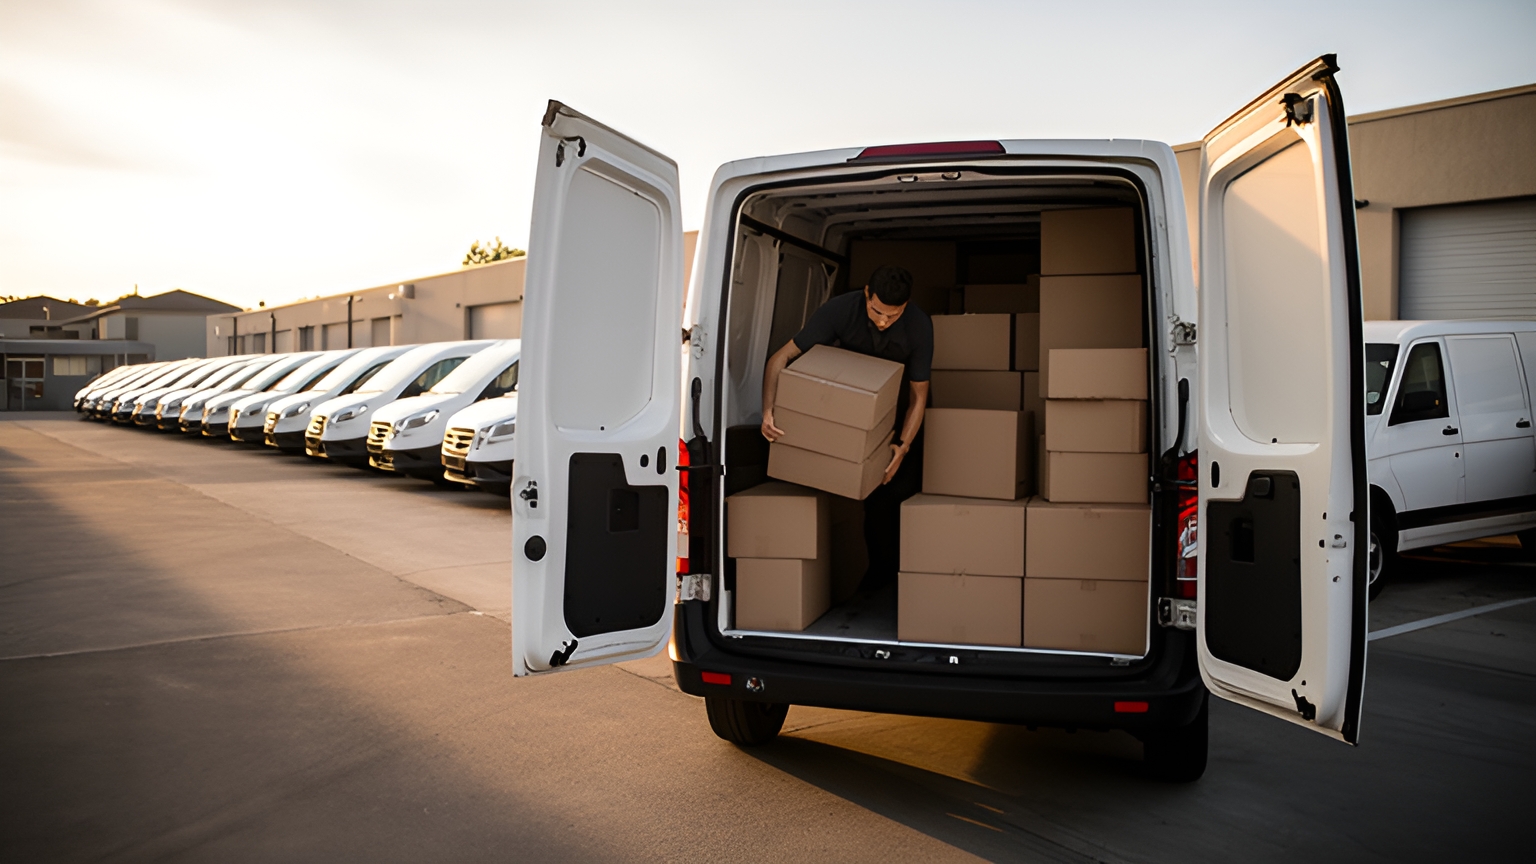
Fleet utilisation metrics show how much of each vehicle's available time, distance and capacity is doing paid work. Track time utilisation (active hours divided by available hours), the loaded share of distance, and load or stops per route-hour. No official utilisation benchmark exists for delivery fleets, so build the baseline from your own fleet data.
Each ratio answers a different question. Time shows whether a vehicle is needed every day. Distance shows how much of its travel carries goods. Load and stops show how much work each hour on the road delivers.
Read side by side, they point to the next decision: keep a vehicle, move it to another depot, rework a route plan or line up extra capacity for a busy season.
Why a useful utilisation baseline starts with your own fleet data
Public statistics do cover parts of fleet utilisation. They record how far freight vehicles travel empty and how much distance each vehicle covers in a year.
Most of them describe heavy freight, though, and each country defines its terms its own way. None gives a delivery fleet a ready-made target for time in use.
That makes your own fleet the most useful benchmark, measured the same way every week.
Three measures cover the core of it:
| Measure | How to calculate it | Data to use | What it tells you |
|---|---|---|---|
| Time utilisation | Active job hours ÷ available hours | Job start and finish times, proof-of-delivery timestamps | Whether the vehicle is needed every day |
| Distance utilisation | Loaded kilometres ÷ total kilometres | GPS tracks matched to each route's stops | How much travel carries goods |
| Load and stop output | Stops or load carried per route-hour | Completed jobs and depot loading records | How much work each hour delivers |
Before the first report, write down how each measure is defined: which hours count as available, what counts as a loaded kilometre, and what one stop means when a single address takes several parcels.
Fixed definitions are what let next quarter's figures sit fairly beside this quarter's.
Then measure each vehicle on its own before grouping by type. A fleet average can hide one van that is stretched every day beside another with room for more work.
If your dispatch and tracking tools already log job times and GPS positions, the raw data for all three measures is already there.
How to choose the denominator that makes time utilisation meaningful
Time utilisation is a fraction, and the bottom half of it decides what the answer means.
Three denominators are worth weighing, and each suits a different question.
Calendar hours count every hour in the day. They suit questions about ownership cost, since a vehicle is paid for whether it is moving or parked. A single-shift fleet will always score low on this basis, and that is expected.
Available hours are the hours your operation could put a vehicle to work, minus planned servicing. This is the denominator for right-sizing, because it compares use with genuine opportunity.
Rostered shift hours are the hours a driver is scheduled. They show how full each shift is, which is driver utilisation, so report them separately from vehicle figures.
As a worked example, take a van with 8 hours of active jobs in a day at a depot that operates 10 hours. Against 24 calendar hours it scores about a third. Against its 10 available hours it scores far higher.
Same van. Same day. Very different story.
Two more choices need settling. Decide whether the spare vehicle counts as available, and whether unplanned repairs come off available hours or stay in as lost time. Either rule works, as long as it never changes.
Then define what active means. Job start and finish times, proof-of-delivery timestamps and GPS movement each give a slightly different picture of when a vehicle was working. Pick one source as the record and use it for every vehicle.
What empty-running benchmarks show, and how multi-drop vans differ
The empty-running figures published by statistics agencies cover heavy freight vehicles, not multi-drop vans, and each agency defines and samples them differently. Read them as a range, not a ranking.
Across the EU in 2025, around one fifth of road freight vehicle-kilometres were travelled by empty vehicles, 21.8% in total, according to Eurostat's road freight statistics. The share was 26.0% for national transport and 12.9% for international transport.
That gap is the useful part for a delivery operator. Shorter domestic runs look more like a delivery fleet's working day than long international ones, so return loads and collections deserve a place in any route review.
The same Eurostat page puts Denmark at the low end of the range, with only 7.6% of vehicle-kilometres travelled by empty vehicles. Empty distance differs widely from one market to the next, which makes it worth measuring rather than assuming.
In Great Britain, the UK Department for Transport's domestic road freight statistics for 2025 put empty running at 31% of the total loaded and empty vehicle kilometres travelled by GB-registered heavy goods vehicles. It measures a different fleet on different definitions, so it widens the range rather than competing with the EU figure.
A multi-drop van works differently from all of these. It leaves the depot loaded and stays loaded until the final drop.
Its empty distance is mostly the run home from the last stop, plus any positioning trip before the first job. So the useful van measure is empty kilometres per route, tracked over time.
Two planning levers shrink it. Pair collections with deliveries, such as returns or supplier pickups, so the trip home carries goods. And sequence routes so the last drop sits closer to the depot, or to where the next route begins.
How annual distance per vehicle gives each vehicle type a fair yardstick
Distance per vehicle per year is simple to collect, and published figures show why one fleet-wide target misleads.
The US Bureau of Transportation Statistics' summary of the 2021 Vehicle Inventory and Use Survey reports that heavy-duty trucks averaged 36,000 miles each in 2021, against 41,000 in 2002.
The average hides the real lesson. The same survey shows 2.9 million truck tractors travelling an average of 48,500 miles in 2021, while 1.6 million other heavy trucks averaged 14,000 miles each.
Judge a short-haul truck against a tractor's distance and it looks idle, even when it works every day. Each vehicle type needs its own yardstick.
Vans follow the same pattern by duty. In Great Britain, the Department for Transport's van statistics, from a 2019-20 survey, found vans used for delivery or collection of goods had the highest average annual mileage, at 21,200, followed by vans providing transport to others at 17,800.
To build your own yardsticks, group vehicles by type and by the work they do. Small vans on dense urban routes form one group, larger vans on regional runs another. Set each group's baseline from its own history, then flag any vehicle well below its group for a closer look.
A low-distance van is not automatically underused. On a tight inner-city route, a van can fill a whole day with stops in very few kilometres, which is why distance needs load and stop measures beside it.
Which load and stop measures capture a delivery van's real output
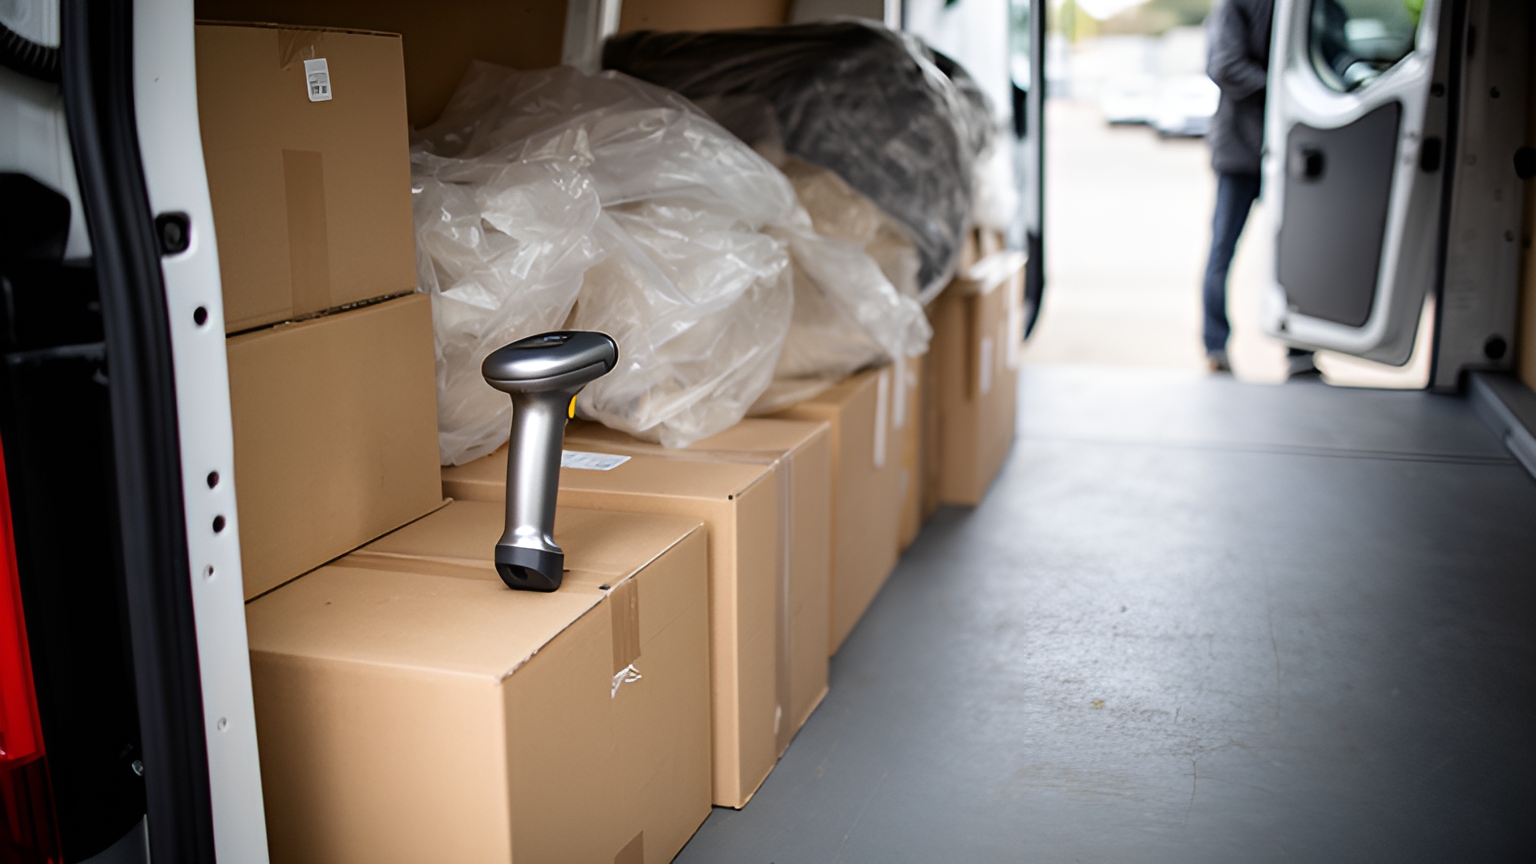
Time and distance show that a vehicle was busy. Output measures show what that busy time delivered.
For a delivery van, four are worth tracking:
- Stops per route-hour: completed stops divided by the hours from depot departure to return. The guide to tracking stops per driver hour covers this measure in more depth.
- Load at departure: volume, weight or loading positions used, divided by the vehicle's capacity. Consistently light loads suggest a smaller vehicle or two routes combined, while full loads on long-running routes suggest a split.
- First-attempt delivery rate: the share of stops completed on the first visit. A second attempt spends time and distance on the same job twice.
- Time on site per stop: for heavy goods, crane unloads or assisted deliveries, the time at the address is the work itself, so it belongs in the plan.
As a worked example, a van that completes 24 stops on a 6-hour route runs at 4 stops per route-hour. Compare it with vans working similar areas, not with the whole fleet.
Planned routes give each measure a target. Locate2u's route optimisation builds routes from delivery locations, time windows and driver availability, so every finished route can be checked against its own plan.
For the customer-facing measures that sit alongside these, see the wider guide to last-mile delivery metrics.
A worked baseline: putting a cost on one depot's empty kilometres
Empty kilometres are easier to prioritise once they carry a cost.
Use your own running cost per kilometre, built from fuel or charging, tyres, servicing and distance-related wear. That is what each empty kilometre actually consumes in your fleet.
The baseline for one depot takes four inputs from your own records, then three simple steps that follow from them.
| Line | How to work it out | Where it comes from |
|---|---|---|
| Vans at the depot | Count of vehicles based there | Your fleet register |
| Distance per van per year | Total kilometres over the year | Odometer readings or GPS |
| Share driven empty, mostly return legs | Empty kilometres ÷ total kilometres | Distance from each route's final completed stop to the depot |
| Running cost per kilometre | Distance-related costs ÷ kilometres driven | Fuel or charging, tyres, servicing and wear records |
| Empty distance per van per year | Distance per van × share driven empty | Follows from the lines above |
| Cost of empty distance per van per year | Empty distance × running cost per kilometre | Follows from the lines above |
| Cost across the depot per year | Cost per van × vans at the depot | Follows from the lines above |
That depot total is not a saving. It is the size of the opportunity, and it shows how much planning attention the return legs deserve.
Now test one lever on the same inputs. Re-run the sheet with a lower empty share for the routes where collections could ride on the return leg, and the gap between the two depot totals is what that lever is worth to you.
Locate2u's real-time tracking shows every vehicle on a live dashboard through the day, which makes it easy to see where each route finishes relative to the depot.
If your vehicles report miles, the method is identical. Keep one unit across the whole baseline.
How a 60% review trigger guides right-sizing and peak capacity
A fleet digitisation report published in 2025 flags assets with below 60% utilisation for redeployment or divestment.
Treat that threshold as a review trigger, not a verdict. Apply it to the time utilisation figure from your chosen denominator, and when a vehicle drops below it, work through a few questions.
Is the dip seasonal? Could the vehicle cover busy routes from another depot? Is it the planned spare? Could two light routes become one?
The same report says telematics data helps right-size fleets, identifying surplus assets or shortages, and optimising rentals during demand peaks.
The shortage side matters as much as the surplus. A vehicle fully booked on every busy day leaves no room for a late order or a van in for service, and that points to a capacity plan for peaks.
Short-term rentals are one option and on-demand courier capacity is another. In Australia, Locate2u's sister brand Zoom2u provides on-demand courier and delivery capacity for overflow and same-day work.
How a patient transport fleet plans its schedules for high utilisation
Patient transport puts every measure in this article against a fixed appointment time.
Patient Transport Services Queensland, known as PTSQ, provides non-emergency medical transport across Queensland, Australia, for patients travelling to and from hospitals, specialist appointments and aged care facilities.
Its fleet covers a vast geographic area. Each vehicle can handle multiple pickups and drop-offs in a day, and trips call for different setups, from wheelchair-accessible vehicles to stretcher transport.
PTSQ's case study describes how the scheduling team once planned routes by hand, balancing appointment times with driver availability, vehicle types and travel distances. That manual process made it difficult to maximise vehicle utilisation, and a last-minute booking or cancellation could unsettle a whole day's schedule.
PTSQ adopted Locate2u for route optimisation and real-time fleet management. The routing engine accounts for patient appointment times, vehicle types, driver availability and geographic constraints, and generates optimised schedules that maximise fleet utilisation while getting every patient to their appointment on time.
A live dashboard shows the dispatch team every vehicle in the fleet. When a transport runs behind because of traffic or a longer patient pickup, the team sees it straight away and can reassign the next pickup to another vehicle or update the receiving facility on the revised arrival time.
For PTSQ, one Australian patient transport service, the result is schedules that send the right vehicle type to each trip and turn spare time on one vehicle into cover for another.
To test the idea on your own routes, take one day from last week, mark which vehicle type each job genuinely needed, and count how many jobs could have moved to a vehicle with spare available hours.
Frequently asked questions
How often should you recalculate utilisation for each vehicle?
Review each vehicle weekly so changes show up while they can still be acted on, and compare monthly trends before deciding to add, move or retire a vehicle. Re-baseline whenever your delivery calendar shifts, such as a new seasonal peak or a new service area.
Should driver utilisation and vehicle utilisation be tracked separately?
Yes. A vehicle can run across two shifts while each driver works one, so report vehicle hours against vehicle availability and driver hours against rostered shift hours, rather than blending them into one figure.
How much history do you need before a utilisation baseline is reliable?
Enough to cover your full demand cycle: your busiest and quietest weekdays, and for seasonal businesses a full year. A baseline built only from a quiet month will make a busy month look like overload.
Is the highest possible utilisation always the goal?
No. A fleet with every vehicle fully booked has no headroom for late orders, urgent jobs or a vehicle in for service, so set a target that leaves room for your busiest days and plan overflow capacity for the rest.
A dependable utilisation baseline comes from a fixed denominator, a fair yardstick for each vehicle type and your own cost on every empty kilometre, reviewed every week. To see how Locate2u's fleet management tools could support that review on your own routes, book a call with the Locate2u team.